
If you work with data analysis and visual representation, you have probably needed to create a diagram or graph, and even a chart to show how the values depend on each other. Sometimes, the data itself grouped in a table does not have much meaning until it is visually displayed. The charts are a great way to present how a value has changed over time and what it all depends on.
The swimlane diagram is a diagram that follows the course of processes, according to which the roles and responsibilities at work are divided. As you already know, a flowchart is a diagram that shows how things depend on each other and what conditions need to be met in order to reach a certain outcome. Swimlane, on the other hand, in addition to a similar visual representation, groups the nodes into columns so that visibility and organization can be enhanced.
In a way, it is a diagram that is placed on a table, so you can see what process it depends on and with whom you should work together to reach the final goal. Such diagrams are great for defining an organizational structure in a company.
The result is a readable and understandable chart, which can be printed on paper, sent, edited, distributed to all employees during a meeting, and in a simple way to show complex relationships between responsible persons, incumbents, and expected results.
Swimlane can have a horizontal or vertical display of grouping nodes. It is called swimlane because it resembles swimming lines in swimming pools. At zenflowchart.com you will find really useful information on how to use this type of diagram and how to integrate it with other diagrams and data visuals.
What are these diagrams used for?
A flowchart is a display of structure, tasks, collaboration relationships. Additional parameters in the swimlane make it ideal for many things, including:
• The stages of development of a product or service
• Marketing strategy
• Sales strategy
• Logistics strategy
• Procurement
• Task structure
• Departments that need to cooperate
Both types of diagrams allow you to make plans in stages and predict how a process will unfold.
To make a good visual, whether it is a flowchart or a swimlane, you must define the following:
• Identify the elements
• Define the structure
• Mark the starting point
• Connect the nodes
• Check if there is a way to simplify the process
By following these steps, you will learn how to successfully apply diagrams, whether analyzing data or defining a workflow.
The advantage of swimlanes is that you can be really precise in defining the responsibilities that employees or teams have, as well as in analyzing the results achieved.
Is swimlane a kind of flowchart?

From all that we have said so far, we can conclude that the so-called swimlane diagrams are an improved type of flowcharts. The difference is in the visual structure.
The lines and columns actually show us how things are separated from each other, but also define the potential links for cooperation.
They are easier to read, clearer, and easier to apply at work. This avoids duplication of tasks and communication problems. That means, the process is completely optimized and simplified, and everyone knows their task. Surely, there can be some changes applied as time goes by.
Benefits of swimlanes

To be able to use them, you must be aware of their advantages and disadvantages. In fact, the only drawback may be the creation process itself, as a huge amount of data really needs to be systematized and stored in a single diagram.
But once that is done, the whole work process runs smoothly, and you can track which task is completed, which is partially completed, and which is still waiting to start.
Also, during the work process you will be able to identify various positive and negative sides and of course, remove them, so as not to waste resources on them. Probably it seems like a lot of jobs, but you are doing this one time, and then you only adjust it to the current situation.
Swimlanes are very useful when you need to show how certain parameters affect the production and sales of a particular product. In this way, you make a detailed analysis of the processes, but also define the ultimate goals, in order to reach the consumer or the user of your services.
Prepare by defining the outline and starting point in Excel or another diagram maker. During the analysis, add nodes, through which you will reach what is the ultimate goal.
If necessary, do more research or survey staff. Make sure to break each complicated step into smaller ones, even if it means adding more symbols and nodes.
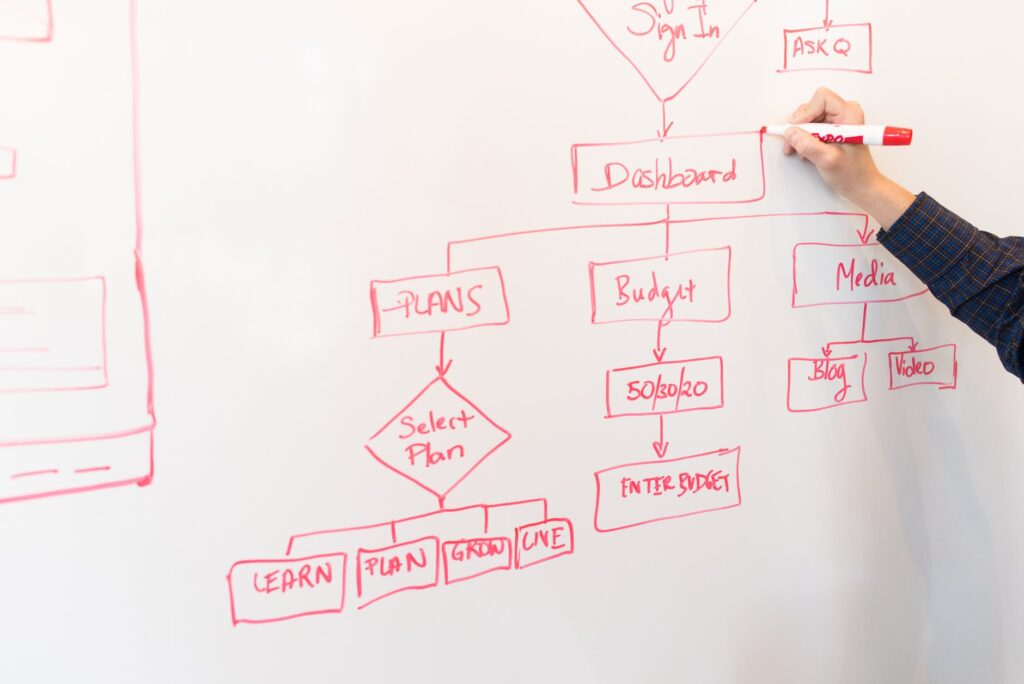
You can even make a sketch by hand and then redraw it all with computer programs. This way you make the diagram accurate and easy to read.
In addition, always add a legend to the symbols, so that anyone who accesses it can read them.
Conclusion
If this idea seems appealing and applicable to you, then it’s worth giving it a try and learning about a new approach to data analysis and manufacturing processes. Every company needs to find the most optimal way of working, without spending more resources than necessary. Truth be told, charts like these can really help.
Of course, the initial outline of the swimlane may change over time, as you will incorporate new parameters, such as new employees or innovative ways of working.
All this is quite good to know and keep in mind when creating a strategy and defining a workflow.
And as for the creation, you can always do it with the help of appropriate software, which will offer you tags and symbols. Of course, you can also use Excel or other spreadsheet solutions, in which you will implement nodes and processes. The goal is to do it in a clear and concise way, which will be applicable to the whole company.